Property Tax Agency Analyzes Southampton Real Estate Market Trends All Year Round, Southampton Town Property Tax Grievance Success Begins With Property Tax Agency Analysis
Southampton Property Tax Grievance Services
-
Southampton Sales Data
Aggregated Real Estate market data* for Southampton Town in 2023, indicating average selling price and market activity broken down by Municipality and School District.
Average Sales Prices Price Sales Bridgehampton $3,950,000 10 East Quogue $1,253,027 33 Eastport $804,000 5 Flanders $592,571 14 Hampton Bays $954,484 92 Quogue $2,573,000 20 Remsenburg $2,280,882 17 Riverhead $529,571 7 Sag Harbor $2,856,806 18 Sagaponack $9,330,000 5 Southampton $2,434,460 63 Speonk $744,200 5 Water Mill $4,757,273 11 Westhampton $1,928,743 19 Westhampton Beach $2,383,161 28 Existing single family homes, excluding foreclosures and auctions, no "flips". Raw data with no trimming. By School District Price Sales Eastport‐South Manor $776,375 8 Sag Harbor $3,103,750 18 Riverhead $781,592 27 Remsenburg‐Speonk $2,452,826 23 Westhampton Beach $2,040,657 39 Quogue $2,559,545 22 Hampton Bays $898,257 76 Southampton $3,131,925 54 Bridgehampton $3,130,000 10 Sagaponack $12,710,000 3 Tuckahoe Common $2,089,100 20 East Quogue $1,147,407 34 Existing single family homes, excluding foreclosures and auctions, no "flips". Raw data with no trimming. Sales Ratio Study
A statistical analysis of the sales in Southampton Town; this data is used to determine the Level of Assessment for an area.
Comparing current sales in a region to the Assessed Values for the sold properties gives us a insight into what areas are misaligned with the Residential Assessment Ratio.
Southampton Sales Ratios June July August MEDIAN 0.525 0.579781 0.522466 MEAN 0.5397 0.56953 0.562323 WEIGHTED 0.495629 0.534453 0.55748 AVG ABS DEVIATION 0.149418 0.115397 0.144454 COEFF DISPERSION 28.460571 19.903549 27.648497 PRICE RELATED DIFF 1.088919 1.0656315 1.008688 TOTAL AV 38,289,300 26,697,500 47,314,400 TOTAL PRICE $77,254,000 $49,952,950 $85,136,500 AVG PRICE $1,931,350 $1,611,385 $1,737,479 N 40 31 49 Calculated using property market data compiled by PTA* and the methodology laid out in New York State Department of Taxation and Finance Office of Real Property Tax Services Level of Assessment Owner's Handbook (pdf). Data is provided for example purposes, and no guarantee of suitability for any purpose is implied.
This data is not the official Town data, nor is it all of the data, but represents about 6 months' data conforming to PTA requirements for market analysis.
-
Southampton Assessments
Statistical distribution of Assessed Values in the Town: by property class, and also by location, allowing for visualization, comparison, and investigation, of current valuations.
Property Class Counts Count Total Parcels 52,177 Agricultural Properties 604 Residential Properties 38,598 Vacant Land 8,450 Commercial Properties 1,755 Recreation and Entertainment Properties 206 Community Service Properties 733 Industrial Properties 47 Public Service Properties 344 Public Parks, Wild, Forested and Conservation 1,440 Source NYS ORPTS Muni Pro Website, Brookhaven Town Distribution of Parcels by Property Class Current Assessment Distribution
Southampton Town Assessed Value Percentiles 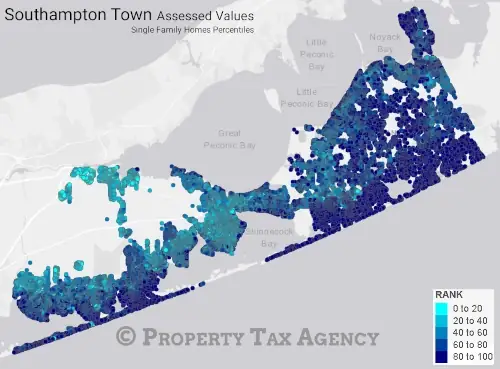
The darker the dot, the higher the percentile of the property in terms of Assessed Value - Navy Blue dots are in the top 20% of all properties in the Town by Assessed Value.
This map illustrates the distribution of Assessed Values for single‐family homes in the Town of Southampton.
By converting Assessment Roll data into interactive mapping system, we can compare sales and Assessment data and plot the locations of each to provide real time analysis of the Real Estate market relative to Levels of Assessment.
The past informs the future
Studying previously granted reductions can give insight into current opportunities.
Southampton Town Granted Reductions 2021-2022 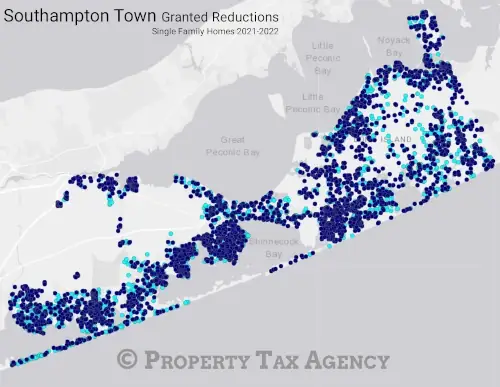
Light blue dots are 2021, navy blue dots are 2022.
One of the research techniques we employ involves investigating recently granted reductions, looking for patterns and trends.
-
Hampton Bays School District
Hampton Bays District Percentiles 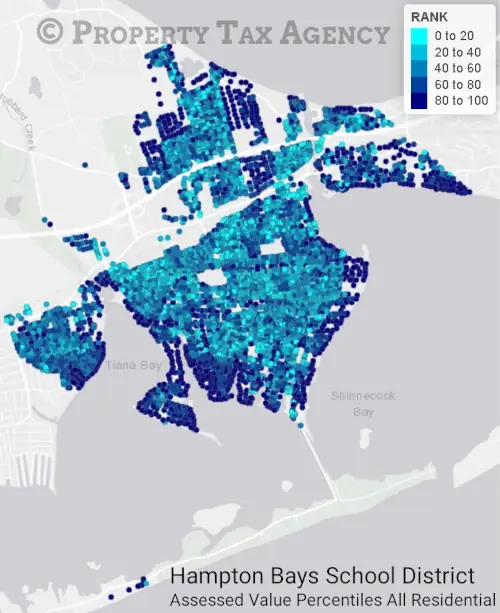
The darker the dot, the higher the percentile of the property in terms of Assessed Value - Navy Blue dots are in the top 20% of all properties in the Town by Assessed Value.
School taxes comprise the majority of most owner's property tax bill; at PTA, assessment analysis is not just performed at the Town level, but also by School District.
Hampton Bays School District is shared below, as an example.
Distribution of Parcels Count Total Parcels 7,067 Agricultural Properties 13 Residential Properties 6,114 Vacant Land 478 Commercial Properties 253 Recreation and Entertainment Properties 34 Community Service Properties 83 Industrial Properties 2 Public Service Properties 24 Public Parks, Wild, Forested and Conservation 66 Source NYS ORPTS Muni Pro Website, Brookhaven Town Distribution of Parcels by Property Class
-

Let PTA Represent You
If you didn't receive a mailer, or don't have your code available, you'll need to provide the property details. It will only take a minute or two.
Apply Today -
Market and Assessment Analysis
Data and analysis that comprise the PTA advantage: leveraging historical data and market trends at the Town, and School District, level.
Learn More -
Frequently Asked Questions
Can't I do this myself? What if my property is in a trust? Will this affect my existing exemptions? Is this a kissing book? All these answers, and more…
Learn More