Sign up for a Property Tax Grievance in Smithtown; This is just some of the aggregated data that informs our analysis, let Property Tax Agency's Analytical Advantage work for you.
Smithtown Property Tax Grievance Services
-
Smithtown Sales Data
This data is not the official Town data, nor is it all of the data, but represents a portion of this years' Smithtown Real Estate market data conforming to PTA requirements* for market analysis.
Data is provided for example purposes, and no guarantee of suitability for any purpose is implied.
Sales Averages
Average Sales by Municipality Municipality Price Sales Commack $732,500 24 Fort Salonga $1,014,000 7 Hauppauge $665,500 5 Head Of The Harbor $1,293,750 4 Kings Park $657,735 97 Lake Ronkonkoma $430,000 1 Nesconset $693,221 81 Nissequogue $1,321,973 19 Northport $1,048,700 23 Saint James $767,946 66 Smithtown $748,995 167 Stony Brook $1,007,500 2 Existing single family homes, excluding foreclosures and auctions, no "flips". Raw data with no trimming. Average Sales by School District School District Price Sales Three Village CSD $1,007,500 2 Sachem CSD $612,520 12 Commack UFSD $762,535 42 Hauppauge UFSD $807,845 38 Smithtown CSD $773,287 297 Kings Park CSD $741,134 122 Existing single family homes, excluding foreclosures and auctions, no "flips". Raw data with no trimming. Sales Ratio Study
Comparing current sales in a region to the Assessed Values for the sold properties gives us a insight into what areas are misaligned with the Level of Assessment.
Sales Ratio Study ‐ Smithtown June July August MEDIAN 0.007893 0.007843 0.007534 MEAN 0.007967 0.008021 0.007692 WEIGHTED 0.008030 0.007941 0.007725 AVG ABS DEVIATION 0.003077 0.001138 0.000980 COEFF DISPERSION 38.986301 14.516969 13.010856 PRICE RELATED DIFF 0.992197 1.010120 0.995718 TOTAL AV 432,862 299,138 426,115 TOTAL PRICE $53,903,974 $37,669,500 $55,158,479 AVG PRICE $869,418 $724,413 $766,089 N 62 52 72 Calculated using property market data compiled by PTA* and the methodology laid out in New York State Department of Taxation and Finance Office of Real Property Tax Services Level of Assessment Owner's Handbook (pdf). Sales Ratio Study ‐ Smithtown AVG Sale Ratio Count Commack 0.0078348 24 Hauppauge 0.0085592 5 Kings Park 0.0077653 97 Nesconset 0.0077988 81 Northport 0.0073333 23 Smithtown 0.0078986 167 Saint James 0.0077139 66 Calculated using property market data compiled by PTA* and the methodology laid out in New York State Department of Taxation and Finance Office of Real Property Tax Services Level of Assessment Owner's Handbook (pdf). -
Smithtown Assessments
Visualization of the distribution of Assessed Values in the Town: by property class, and also by location.
Property Class Counts
Distribution of Parcels Parcel Type Count Total Parcels 43,490 Agricultural Properties 4 Residential Properties 37,041 Vacant Land 2,740 Commercial Properties 1,540 Recreation and Entertainment Properties 42 Community Service Properties 1,161 Industrial Properties 44 Public Service Properties 586 Public Parks, Wild, Forested and Conservation 328 Source NYS ORPTS Muni Pro Website, Brookhaven Town Distribution of Parcels by Property Class Assessed Values Percentile Map
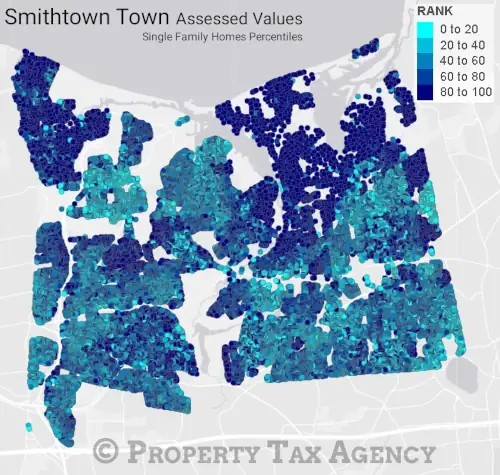
Smithtown Assessed Value Percentiles 
The darker the dot, the higher the percentile of the property in terms of Assessed Value - Navy Blue dots are in the top 20% of all properties in the Town by Assessed Value.
Here is the baseline map for comparative analysis of Market Values and Assessed Values, which is a major factor in defining fairly or over‐⁄under‐ assessed properties and neighborhoods.
Granted Reductions Map
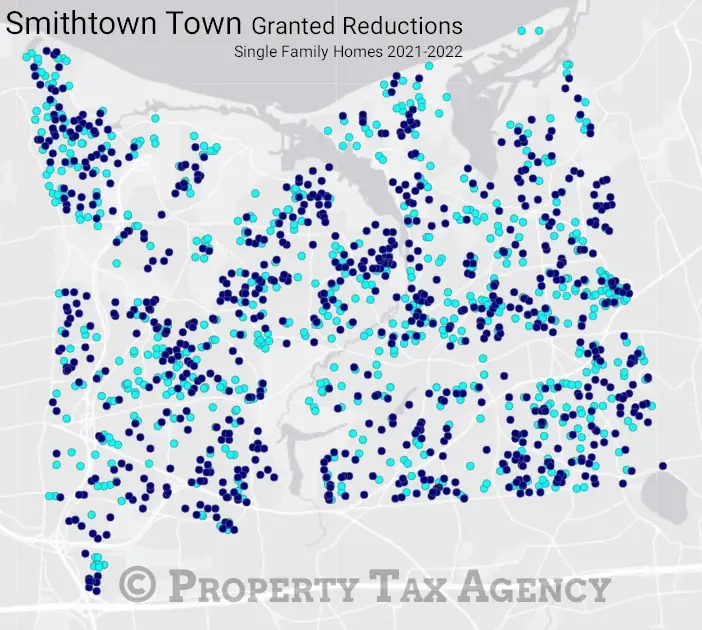
Smithtown Granted Assessment Reductions 
Light blue dots are 2021, navy blue dots are 2022.
Research includes looking at the recent past for granted reductions, we can compare sales market metrics to current conditions to help determine if there are continuing or strengthening trends.
-
Smithtown School District
Smithtown School District is the largest School District in the Town, and pretty evenly distributed with about 1⁄2 of properties in the top 1⁄2 of Assessed Values in the Town.
Median Town Percentile School District Median Town Rank Sachem (1,270) 28.65 Smithtown (20,694) 51.11 Kings Park (8,123) 41.69 Commack (7,418) 51.18 Hauppauge (4,766) 62.36 Three Village (108) 92.59 Property Types Within Smithtown School District
Over 85% residential, with 7% vacant land; 3.5% commercial⁄industrial.
Distribution of Parcels Parcel Type Count Total Parcels 20,786 Agricultural Properties 4 Residential Properties 17,912 Vacant Land 1,468 Commercial Properties 712 Recreation and Entertainment Properties 24 Community Service Properties 329 Industrial Properties 13 Public Service Properties 172 Public Parks, Wild, Forested and Conservation 152 Source NYS ORPTS Muni Pro Website, Brookhaven Town Distribution of Parcels by Property Class Assessed Values Percentile Map
Visualization can unlock insights that spreadsheets alone sometimes cannot.
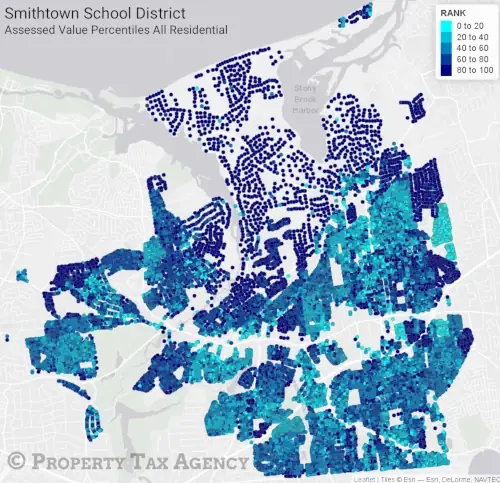
Smithtown School District Assessment Percentiles 
The darker the dot, the higher the percentile of the property in terms of Assessed Value - Navy Blue dots are in the top 20% of all properties in the Town by Assessed Value.
By converting Assessment Roll data into our interactive mapping system, we can compare sales and Assessment data and plot the locations of each to provide real time analysis of the Real Estate market relative to Levels of Assessment.
-

Let PTA Represent You
If you didn't receive a mailer, or don't have your code available, you'll need to provide the property details. It will only take a minute or two.
Apply Today -

Statistical Analysis
Data and analysis that comprise the PTA advantage: leveraging historical data and market trends at the Town, and School District, level.
Learn More -

Frequently Asked Questions
Can't I do this myself? What if my property is in a trust? Will this affect my existing exemptions? Is this a kissing book? All these answers, and more…
Learn More