Market Research is a year-round process, calculating and comparing more than 6 different metrics each month for various regions from Townships, to School Districts, or neighborhood level analysis.
Smithtown Average Home Sales Price and Sales Ratio Study
-
Sales Market Analysis by Property Tax Agency
Tracking sales not only by municipality, but also School District and neighborhood.
All year long, current market data is continually updated and analyzed for trends and opportunities; it is this information that gives us an advantage in marketing efficiency.
Combining location data with assessment maps allows for conducting Sales Ratio Studies on these same defined areas.
Additional Smithtown Assessment data can be found on the Smithtown Statistics page.
Average Sale By Municipality Municipality Price Sales Commack $732,500 24 Fort Salonga $1,014,000 7 Hauppauge $665,500 5 Head of the Harbor $1,293,750 4 Kings Park $657,735 97 Lake Ronkonkoma $430,000 1 Nesconset $693,221 81 Nissequogue $1,321,973 19 Northport $1,048,700 23 Saint James $767,946 66 Smithtown $748,995 167 Stony Brook $1,007,500 2 Existing single family homes, excluding foreclosures and auctions, no "flips". Raw data with no trimming. Average Sale By School District School District Price Sales Three Village $1,007,500 2 Sachem $612,520 12 Commack $762,535 42 Hauppauge $807,845 38 Smithtown $773,287 297 Kings Park $741,134 122 Existing single family homes, excluding foreclosures and auctions, no "flips". Raw data with no trimming. Sales Ratio Study Results‐ Smithtown
Sales Ratio Study Results June July August MEDIAN 0.007893 0.007843 0.007534 MEAN 0.007967 0.008021 0.007692 WEIGHTED 0.008030 0.007941 0.007725 AVG ABS DEVIATION 0.003077 0.001138 0.000980 COEFF DISPERSION 38.986301 14.516969 13.010856 PRICE RELATED DIFF 0.992197 1.010120 0.995718 TOTAL AV 432,862 299,138 426,115 TOTAL PRICE $53,903,974 $37,669,500 $55,158,479 AVG PRICE $869,418 $724,413 $766,089 N 62 52 72 Calculated using property market data compiled by PTA* and the methodology laid out in New York State Department of Taxation and Finance Office of Real Property Tax Services Level of Assessment Owner's Handbook (pdf). Sales Ratio Study ‐ Smithtown AVG Sale Ratio Count Commack 0.0078348 24 Hauppauge 0.0085592 5 Kings Park 0.0077653 97 Nesconset 0.0077988 81 Northport 0.0073333 23 Smithtown 0.0078986 167 Saint James 0.0077139 66 Calculated using property market data compiled by PTA* and the methodology laid out in New York State Department of Taxation and Finance Office of Real Property Tax Services Level of Assessment Owner's Handbook (pdf). Sales Ratio Study ‐ Smithtown Schools AVG Sale Ratio Count Commack 0.0076239 42 Hauppauge 0.0081918 38 Kings Park 0.0078458 122 Sachem 0.0081614 12 Three Village 0.0082319 2 Smithtown 0.0080900 297 Saint James 0.0077139 66 Calculated using property market data compiled by PTA* and the methodology laid out in New York State Department of Taxation and Finance Office of Real Property Tax Services Level of Assessment Owner's Handbook (pdf). -
What's a Ratio Study?
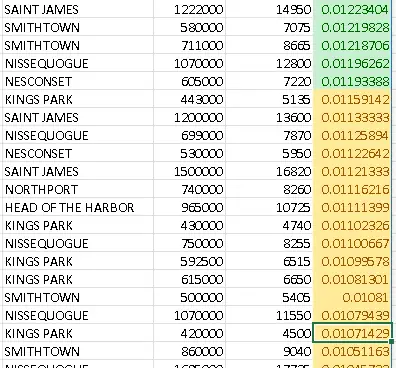
One of the most significant metrics that we track are what's known as Sales Ratio Studies ‐ a statistical analysis of selling price in an area compared to assessed value.
Smithtown Sale Ratios 
These calculations are used in determing the Level of Assessment, which is the percentage of market value properties in a jurisdiction are assessed.
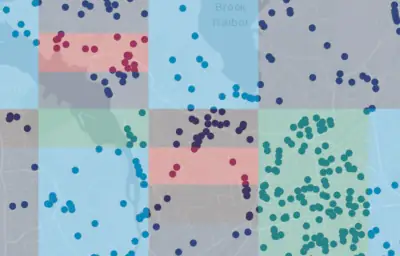
While the LOA calculations use averaged data, we apply this metric to all sales, and comparable properties their immediate vicinity‐ creating a real‐time map of how the current market conditions compare to Assessments.
Throughout the year, it essentially becomes a heat‐map of where, and by how much, purchase prices are trailing Levels of Assessment.
Smithtown Sales Ratio Heatmap 
Sales Ratio Study ‐ Smithtown
For the month of June, we have 62 sales with a total selling price of $53,903,974.
When we total up the Assessed Values for our 62 sold homes, we get 432,862
To determine our weighted ratio, divide 432,862 by 53,903,974 = 0.008030
We also determine the sale ratio for each property, by dividing its Assessed Value by Selling Price, and record the mean (0.007967) and median (0.007893) values of the set.
Price Related Differential
One of the first analyses that we can now perform is determining the Price Related Differential: we divide our mean ratio value (0.007967) by the weighted ratio (0.008030)
This value will tell us how much skew we see between high‐value and low‐value properties by how far above or below 1 it is.
Acceptable values range from 0.98 to 1.03, so these are right down the middle of the fairway.
Additional Statistical Analysis
There are other measures as well, such as our average error, the Coefficient of Dispersion ‐ the average percentage deviation from the median ratio, June looks like it was interesting…
These analyses are also performed on School District regions, comparing local sales data to assessment data for a more precise marketing target area.
Calculated using property market data compiled by PTA* and the methodology laid out in New York State Department of Taxation and Finance Office of Real Property Tax Services Level of Assessment Owner's Handbook (pdf).
This is not official Town data, nor is it the whole year's data: this represents a portion of the information collected and collated that conforms to PTA analysis requirements. Data is for example purposes only, no suitability for any purpose is implied.
-

Let PTA Represent You
If you didn't receive a mailer, or don't have your code available, you'll need to provide the property details. It will only take a minute or two.
Apply Today -

Assessment Map Analysis
Reviewing Assessment distributions is a fundamental step in our research process, statistical and geographical analysis of the Town of Babylon and the Sayville School District
Learn More -

How a Grievance can Save You
Lowering the value used for multiplying by the tax rates for your property will result in a lower bill. Learn about how your tax bill is calculated.
Learn More