Location, Location, Location.
It's everything when it comes to understanding the real estate market; and understanding market trends is a fundamental building block for sound Property Tax Grievance analysis.
Using Mapping Technology to Visualize Assessment Distribution
-
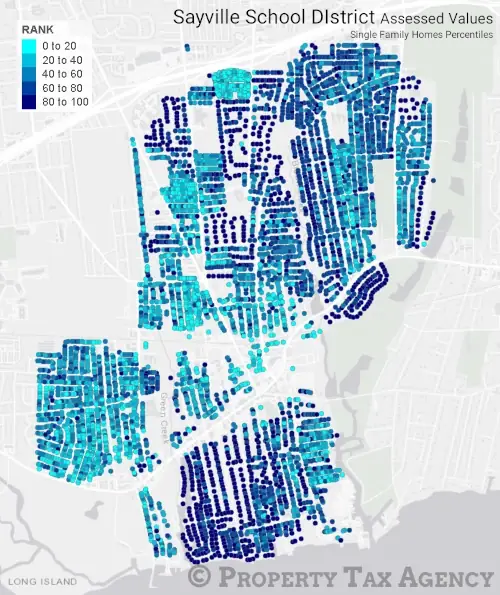
Assessed Value Percentiles Map ‐ Sayville School District
This map illustrates the distribution of Assessed Values for single‐family homes in the Sayville School District.
Sayville School District Percentiles 
The darker the dot, the higher the percentile of the property in terms of Assessed Value - Navy Blue dots are in the top 20% of all properties in the district by Assessed Value.
Percentiles are calculated against all properties within the district, however the map only includes residential properties for clarity.
School District is a major consideration when purchasing a property, and School Taxes comprise the majority of most property tax bills.
Despite the importance of School Taxes on Long Island, most firms don't seem to perform Property Tax analysis in regards to School District.
Sayville Assessed Valuation Within the Town of Islip
From a Township perspective, the median percentile rank for Sayville School District is 62.7%, meaning half of the properties in the Sayville School District are in the top 37% by Assessed Value in the Town of Islip.
Compared with surrounding districts median Town Assessed Value Percentile:
Bayport‐Blue Point (63.7), Connetquot (56.7), and the Islip portion of Sachem (55.6) -
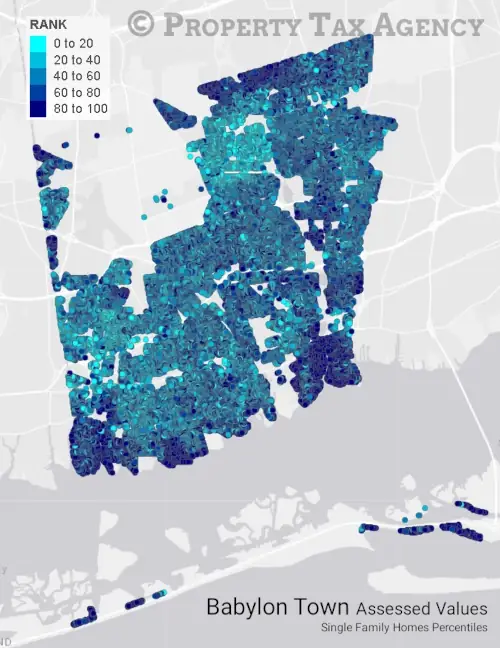
Assessed Value Percentiles Map ‐ Babylon Town
This map illustrates the distribution of Assessed Values for single‐family homes in the Town of Babylon.
Babylon Town Percentiles 
The darker the dot, the higher the percentile of the property in terms of Assessed Value - Navy Blue dots are in the top 20% of all properties in the Town by Assessed Value.
The interesting data points in analysis, for most purposes, are almost always the outliers: dark blue spots that are surrounded by lighter blue, potentially indicating a property that is overassessed relative to the surrounding neighborhood.
This analysis, on its own, is not conclusive; however, it does serve as a starting point for neighborhood analysis when cross‐referenced with recent sales trends.
One such analysis is Sales Ratio which is a comparison of the sale price to Assessed Value, mapping this data provides insight into market regions where pricing may be trailing Levels of Assessment.
These custom designed map systems allow for detailed study for arbitrary regions as small as 300 Meters2, as well as for proximity to Mass Transit, shoreline, Hospitals, even "legitimate theaters" (Property Class 511).
-

Analyzing Sales Data
Learn some of the sales market data collected and analysis techniques used by PTA, such as performing a Sales Ratio Study using Smithtown as an example
Learn More -

Let PTA Represent You
If you didn't receive a mailer, or don't have your code available, you'll need to provide the property details. It will only take a minute or two.
Apply Today -

Statistical Analysis
Data and analysis that comprise the PTA advantage: leveraging historical data and market trends at the Town, and School District, level.
Learn More