Some statistical facts and figures about Property Tax Assessments in Suffolk County Towns, and granted property tax reductions in Town of Brookhaven.
Suffolk County Property Tax Assessment Information
-
Assessment Data in Suffolk County
Assessments in Suffolk County are performed at the Town, and sometimes Village, level.
Our focus is at the Town level, since that is the Assessment used to calculate your School Tax Bill (and that's how we get paid).
The starting point for all research begins with the Property Tax Roll, which we have converted into a database and mapping system which allows for performing any number of statistical analyses.
Current Real Estate sales data is also compiled and collated, it is analyzed for historical comparison; month‐to‐month and anually, and also compared to Assessed Values‐ for instance via Sales Ratio Studies at the Town, School District, or neighborhood level.
Suffolk County Statistics
Suffolk is an overwhelmingly residential County ‐ about 79% ‐ and has more vacant parcels (10%) than commercial and industrial combined (7%).
Suffolk County Parcel Counts Township Total Parcels Babylon 69,813 Brookhaven 185,066 East Hampton 24,708 Huntington 74,038 Islip 98,790 Riverhead 16,608 Shelter Island 3,475 Smithtown 43,490 Southampton 52,177 Southold 18,710 Property Types Township Residential Vacant Commercial & Industrial Babylon 54,852 5,271 7,590 Brookhaven 137,089 24,070 16,115 East Hampton 18,631 3,351 1,635 Huntington 64,197 4,009 3,316 Islip 83,518 4,946 8,206 Riverhead 12,613 1,359 811 Shelter Island 2,468 667 87 Smithtown 37,041 2,740 1,588 Southampton 38,598 8,450 1,802 Southold 13,651 2323 1,211 Source NYS ORPTS Muni Pro Website, Suffolk County Distribution of Parcels by Property Class
Residential Assessment Ratios
Residential Assessment Ratios Township 2022 RAR (%) 2023 RAR (%) 2024 RAR (%) Babylon 0.71 0.66 0.67 Brookhaven 0.74 0.62 0.53 East Hampton 0.45 0.37 0.35 Huntington 0.54 0.47 0.46 Islip 8.28 7.28 7.10 Riverhead 10.14 8.29 8.34 Shelter Island 89.0 73.0 68.0 Smithtown 0.98 0.87 0.86 Southampton 79.0 69.5 63.0 Southold 0.70 0.57 0.55 A Residential Assessment Ratio is a "measurement of the overall ratio of the total assessed value of residential property in the municipality compared to the full market value."
It is this percentage of full market value that is used to determine a residential property's assessed value.
How Stale is this Roll?
The records apparently only go back to 1974, when the hall of records mysteriously blew away.
Most Recent Reassessment Township Last Reassessment Babylon Prior to 1974 Brookhaven Prior to 1974 East Hampton Prior to 1974 Huntington Prior to 1974 Islip 1979 Riverhead 1980 Shelter Island 2021 Smithtown Prior to 1974 Southampton 2019 Southold Prior to 1974 More than a few Towns in Suffolk County are going on 50 years ‐ or more ‐ since their most recent reassessment (pdf).
There isn't a tremendous amount of change from year to year most of the Assessment Rolls, except for new construction, properties with permitted work, and those granted reductions.
Granted Reductions by Town Town (Single Family Homes*) 2021 2022 Babylon (53,000) 692 (1.3%) 557 (1%) Brookhaven (119,850) 2005 (1.6%) 1246(1%) East Hampton (18,300) 547 (3%) 468 (2.5%) Huntington (58,900) 3183 (5.3%) 2086 (3.5%) Islip (75,300) 542 (0.7%) 776 (1%) Riverhead (10,900) 106 (1%) 193 (1.7%) Smithtown (36,000) 640 (1.75%) 769 (2.1%) Southampton (35,400) 1389 (3.8%) 2926 (8.1%) Southold (12,750) 308 (2.4%) 240 (1.8%) * Property Class 210, rounded down.
-
Analyzing Granted Reductions
Study the Past if You Would Define the Future
‐Confucius‐‐Shane M. Coyle
One of the research techniques we employ involves investigating recently granted reductions, looking for patterns and trends.
We can then review the historical sales data from that period to compare it with current metrics and ascertain whether a trend is likely to continue or possibly intensify.
Granted Reductions Map ‐ Brookhaven
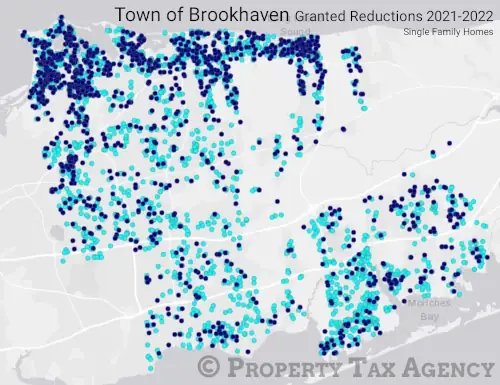
Granted Reductions Map 2021-2022 
Light blue are 2021 reductions, Navy blue are 2022.
Last year (2023) , there were fewer than 1400 reductions granted on single‐family homes in the Town of Brookhaven.
This total was up slightly from the previous year's 1250 or so, which was down sharply from about 2000 year prior to that.
For reference, there's a total of about 120,000 such properties in the Town, meaning only between about 1% to 1.7% of single family homes were granted reductions over the last 3 years.
Just based on the map, does there appear to be any pattern?
Brookhaven Granted Reductions By School District
We can also analyze reductions by School District; after all, School District plays an important role in Long Island Real Estate markets‐ to analyze sales trends without factoring for School District wouldn't make any sense.
School Taxes make up the majority of property owners' tax bills, it doesn't make sense to analyze Property Taxes in Suffolk County without regard to these trends, either.
Granted Reductions by School District School District 2021 2022 2023 Three Village CSD 439 387 465 Comsewogue UFSD 53 28 88 South Country CSD 122 32 31 Sachem CSD 145 54 58 Port Jefferson UFSD 71 76 55 Mount Sinai UFSD 56 46 63 Miller Place UFSD 155 102 135 Rocky Point UFSD 94 79 61 Shoreham Wading River CSD 94 104 52 Middle Country CSD 93 66 77 Longwood CSD 156 61 99 Patchogue / Medford UFSD 105 39 28 William Floyd UFSD 255 74 66 Center Moriches UFSD 35 14 19 East Moriches UFSD 37 20 22 Eastport / South Manor UFSD 81 60 38 Bayport / Blue Point UFSD 13 4 7 Fire Island UFSD 0 0 1 Riverhead CSD 1 0 0 Visualizations Provide Insight
Sometimes it's easy to miss an interesting number is a sea of numbers, this is where visualization of statistical data can be instructive.
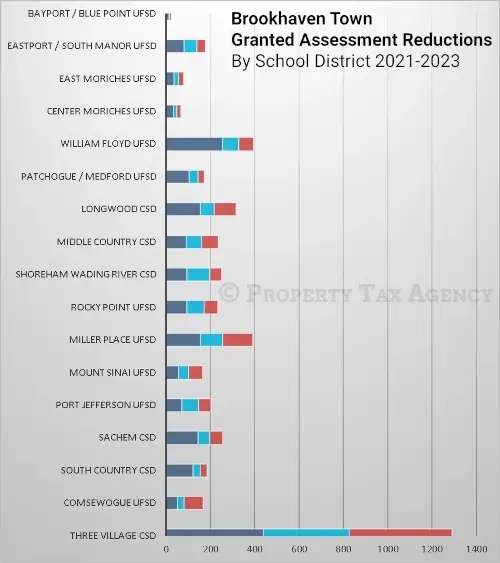
Granted Reductions Chart 2021-2023 
If it didn't jump out at you, let me just take a second to point out Three Village School District‐ it has consistently been the area of most reductions granted in the Town of Brookhaven over that time period, the bar chart may make that more clear.
Over the last 3 years, each year more reductions were granted in Three Village than just about* any other School District's total for the last 3 years combined!
The three year totals for Miller Place (392) and William Floyd (395) edge out 2022 in Three Village (387).
Determining Continuing Trends
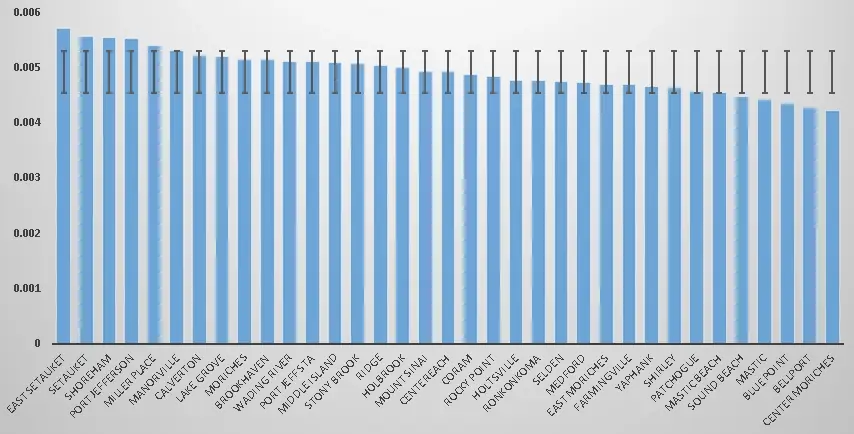
A glance at this year's market data indicates that the pattern seems to be continuing, with Setauket and East Setauket showing the greatest deviation above the PTA mean Sales Ratio in Brookhaven during 2023 of about 0.00485.
2023 Brookhaven Sales Ratios 
As evidenced in the map, and confirmed by ongoing data collection, the north shore in general has seen a prolonged period of market values not advancing at the same rate as Assessment Levels.
-

Analyzing Sales Data
Learn some of the sales market data collected and analysis techniques used by PTA, such as performing a Sales Ratio Study using Smithtown as an example
Learn More -

Assessment Map Analysis
Reviewing Assessment distributions is a fundamental step in our research process, statistical and geographical analysis of the Town of Babylon and the Sayville School District
Learn More -

Let PTA Represent You
If you didn't receive a mailer, or don't have your code available, you'll need to provide the property details. It will only take a minute or two.
Apply Today