Sign up for a Property Tax Grievance.
Property Tax Agency has the data and expertise to determine if you are eligible for a reduction.
Town of Islip Property Tax Grievance Services
-
Islip Sales Data
All year long, Real Estate Market data* for Town of Islip is collated and charted, comparing to historical records for the same area and current Levels of Assessment.
Average Sale Prices Price Sales Great River $1,033,166 6 Islandia $504,666 9 Hauppauge $664,305 29 Holbrook $575,136 73 Brightwaters $712,340 22 Oakdale $705,567 37 Bay Shore $568,069 209 Ronkonkoma $536,573 82 Islip Terrace $573,777 45 Brentwood $508,415 143 Islip $591,301 53 Holtsville $567,000 5 Sayville $673,842 57 Bohemia $634,710 31 West Islip $764,863 124 East Islip $646,474 59 Central Islip $477,144 100 Bayport $724,752 24 West Sayville $600,285 14 Ocean Beach $1,250,000 1 Existing single family homes, excluding foreclosures and auctions, no "flips". Raw data with no trimming. By School District Price Sales Brentwood $510,437 211 Bay Shore $591,297 141 West Islip $767,007 139 East Islip $641,278 104 Sachem $581,605 71 Hauppauge $664,040 34 Central Islip $494,626 106 Islip $626,362 69 Connetquot $601,719 157 Bayport‐Blue Point $757,891 18 Sayville $676,461 65 Fire Island $1,616,666 3 Existing single family homes, excluding foreclosures and auctions, no "flips". Raw data with no trimming. Comparing current sales in a region to the Assessed Values for the sold properties gives us a insight into what areas are misaligned with the Residential Assessment Ratio.
Islip Town Sales Ratio Study June July August MEDIAN 0.065714 0.066 0.066905 MEAN 0.067746 0.0678619 0.067179 WEIGHTED 0.066953 0.0667336 0.065922 AVG ABS DEVIATION 0.008782 0.0078705 0.008223 COEFF DISPERSION 13.364915 11.925 12.291378 PRICE RELATED DIFF 1.011846 1.016906 1.019060 TOTAL AV 6,399,600 5,074,550 5,890,850 TOTAL PRICE $95,582,396 $76,041,796 $89,359,764 AVG PRICE $597,389 $594,076 $647,534 N 160 128 138 Calculated using property market data compiled by PTA* and the methodology laid out in New York State Department of Taxation and Finance Office of Real Property Tax Services Level of Assessment Owner's Handbook (pdf). Data is provided for example purposes, and no guarantee of suitability for any purpose is implied.
This data is not the official Town data, nor is it all of the data, but represents about 6 months' data conforming to PTA requirements* for market analysis.
-
Islip Assessment Statistics
Visualization of the distribution of Assessed Values in the Town: by property class, and also by location.
Property Class Counts Parcel Type Count Total Parcels 98,790 Agricultural Properties 3 Residential Properties 83,518 Vacant Land 4,946 Commercial Properties 7,837 Recreation and Entertainment Properties 193 Community Service Properties 570 Industrial Properties 369 Public Service Properties 1,026 Public Parks, Wild, Forested and Conservation 328 Source NYS ORPTS Muni Pro Website, Brookhaven Town Distribution of Parcels by Property Class Assessed Values Percentile Map
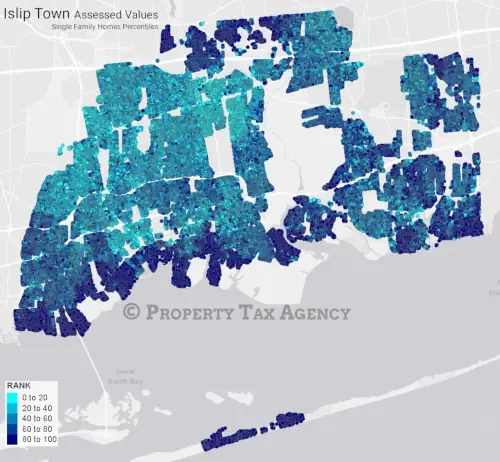
Islip Town Percentiles 
The darker the dot, the higher the percentile of the property in terms of Assessed Value - Navy Blue dots are in the top 20% of all properties in the Town by Assessed Value.
The interesting data points in analysis, for most purposes, are almost always the outliers: dark blue spots that are surrounded by lighter blue, potentially indicating a property that is overassessed relative to the surrounding neighborhood.
This analysis, on its own, is not conclusive; however, it does serve as a starting point for neighborhood analysis when cross‐referenced with recent sales trends.
Granted Reductions Map
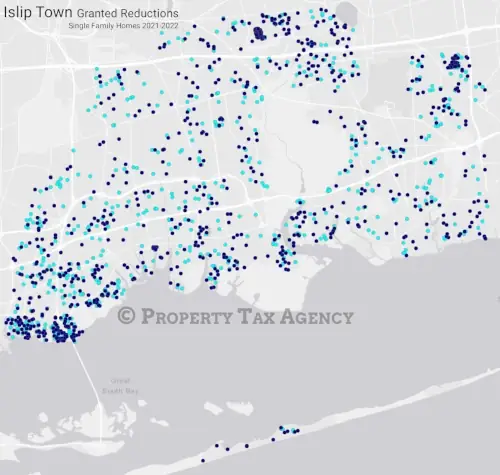
Islip Town Granted Reductions 
Light blue dots are 2021, navy blue dots are 2022.
Plotting previously granted Assessment Reductions can be informative, we are able to compare historical and current Real Estate market conditions to Assessment data to identify areas of interest.
-
West Islip School District Analysis
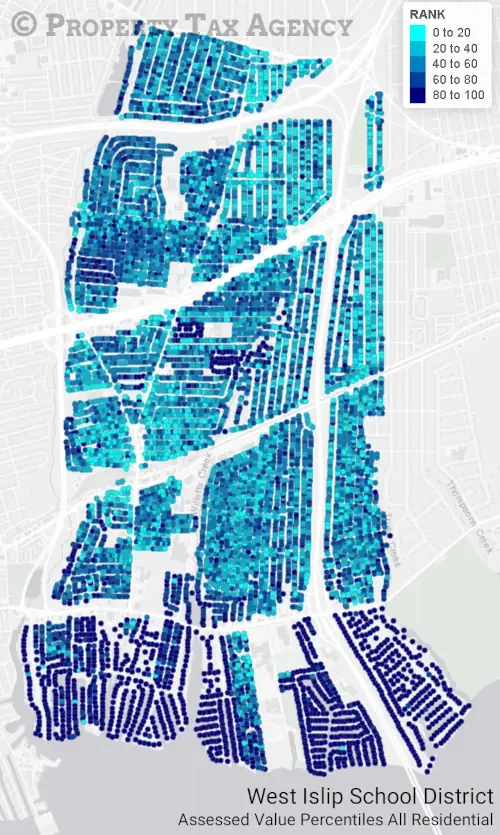
West Islip School District Percentiles 
The darker the dot, the higher the percentile of the property in terms of Assessed Value - Navy Blue dots are in the top 20% of all properties in the Town by Assessed Value.
School taxes comprise the majority of most owner's property tax bill; at PTA, assessment analysis is not just performed at the Town level, but also by School District.
West Islip School District is 94% residential, with a Median Town Percentile Rank of 67.69 meaning half of the properties in West Islip School District are in the top 1⁄3 of all properties in Town of Islip.
West Islip School District Parcel Type Count Total Parcels 9,172 Agricultural Properties 0 Residential Properties 8,612 Vacant Land 266 Commercial Properties 211 Recreation and Entertainment Properties 10 Community Service Properties 33 Industrial Properties 3 Public Service Properties 30 Public Parks, Wild, Forested and Conservation 7 Source NYS ORPTS Muni Pro Website, Brookhaven Town Distribution of Parcels by Property Class
-

Let PTA Represent You
If you didn't receive a mailer, or don't have your code available, you'll need to provide the property details. It will only take a minute or two.
Apply Today -

Market and Assessment Analysis
Data and analysis that comprise the PTA advantage: leveraging historical data and market trends at the Town, and School District, level.
Learn More -

Frequently Asked Questions
Can't I do this myself? What if my property is in a trust? Will this affect my existing exemptions? Is this a kissing book? All these answers, and more…
Learn More