Let Property Tax Agency help you save on your property taxes, advanced data analysis and year‐round market monitoring determine our strategy.
Town of Huntington Property Tax Grievance Services
-
Huntington Sales Data
All year long, Real Estate Market data for Town of Huntington is collated and charted, comparing to historical records for the same area and current Levels of Assessment.
Average Sales Prices Municipality Price Sales Centerport $841,649 42 Commack $693,172 29 Dix Hills $830,000 2 East Northport $718,801 155 Greenlawn $868,014 35 Halesite $847,500 2 Huntington $853,333 121 Huntington Bay $1,682,871 7 Huntington Station $555,179 174 Northport $926,838 63 South Huntington $653,689 16 West Hills $1,335,000 1 Existing single family homes, excluding foreclosures and auctions, no "flips". Raw data with no trimming. Aggregated Real Estate market data* for Huntington Town in 2023, indicating average selling price and market activity broken down by Municipality and School District.
School District Sales Averages School District Price Sales Elwood $742,906 54 Huntington $805,134 123 Northport‐East Northport $756,717 129 Half Hollow Hills $830,000 2 Harborfields $886,378 84 Commack $781,508 62 South Huntington $578,998 147 Existing single family homes, excluding foreclosures and auctions, no "flips". Raw data with no trimming. Comparing Current Sales to Assessments
These calculations are used in determing the Level of Assessment, which is the percentage of market value properties in a jurisdiction are assessed.
Sales Ratio Study Metric June July August MEDIAN 0.004526 0.004312 0.004425 MEAN 0.004608 0.004271 0.004538 WEIGHTED 0.004456 0.004097 0.004381 AVG ABS DEVIATION 0.000820 0.000735 0.000934 COEFF DISPERSION 18.11869 17.03557 21.11226 PRICE RELATED DIFF 1.034008 1.042466 1.009859 TOTAL AV 412560 388305 419405 TOTAL PRICE $92,577,856 $94,780,799 $95,725,424 AVG PRICE $925,778 $894,158 $832,395 N 100 106 115 Calculated using property market data compiled by PTA* and the methodology laid out in New York State Department of Taxation and Finance Office of Real Property Tax Services Level of Assessment Owner's Handbook (pdf). Comparing current sales in a region to the Assessed Values for the sold properties gives us a insight into what areas are misaligned with the Residential Assessment Ratio.
Data is provided for example purposes, and no guarantee of suitability for any purpose is implied.
This data is not the official Town data, nor is it all of the data, but represents about 6 months' data conforming to PTA requirements* for market analysis.
-
Huntington Assessments
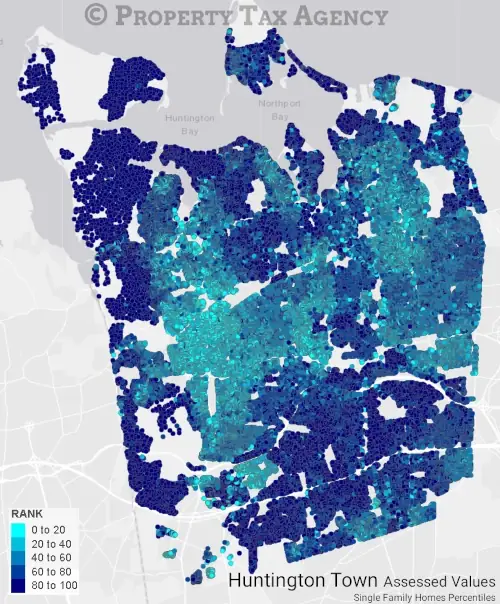
Visualization of the distribution of Assessed Values in the Town: by property class, and also by location.
Property Class Counts Parcel Type Count Total Parcels 74,038 Agricultural Properties 63 Residential Properties 64,197 Vacant Land 4,009 Commercial Properties 3,275 Recreation and Entertainment Properties 141 Community Service Properties 686 Industrial Properties 91 Public Service Properties 1,142 Public Parks, Wild, Forested and Conservation 434 Source NYS ORPTS Muni Pro Website, Brookhaven Town Distribution of Parcels by Property Class Assessed Values Percentile Map
Huntington Town Percentiles 
The darker the dot, the higher the percentile of the property in terms of Assessed Value - Navy Blue dots are in the top 20% of all properties in the Town by Assessed Value.
The interesting data points in analysis, for most purposes, are almost always the outliers: dark blue spots that are surrounded by lighter blue, potentially indicating a property that is overassessed relative to the surrounding neighborhood.
Granted Reductions Map
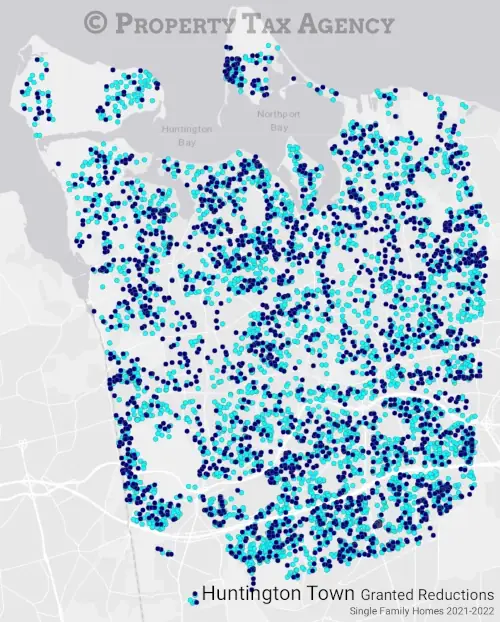
Huntington Town Granted Reductions 
Light blue dots are 2021, navy blue dots are 2022.
One of the research techniques we employ involves investigating recently granted reductions, looking for patterns and trends.
We can then review the historical sales data from that period to compare it with current metrics and ascertain whether a trend is likely to continue or possibly intensify.
-
Huntington School District
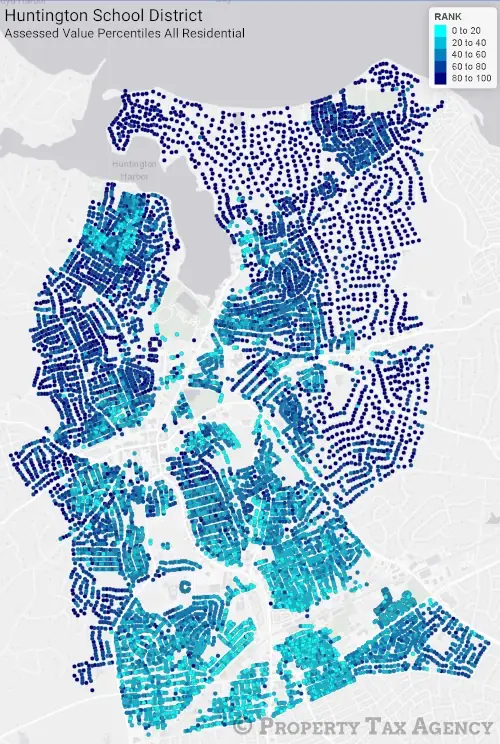
Huntington School District Percentiles 
The darker the dot, the higher the percentile of the property in terms of Assessed Value - Navy Blue dots are in the top 20% of all properties in the Town by Assessed Value.
School taxes comprise the majority of most owner's property tax bill; at PTA, assessment analysis is not just performed at the Town level, but also by School District.
Median Town Percentile School District Median Town Rank Elwood (4,740) 47.16 Huntington (12,449) 44.42 South Huntington (13,274) 32.28 Commack (5,084) 53.23 Half Hollow Hills (14,010) 74.03 Harborfields (6,807) 56.03 Northport East Northport (13,669) 48.35 Cold Spring Harbor (2,572) 94.24 Parcel Distribution Parcel Type Count Total Parcels 8,172 Agricultural Properties 0 Residential Properties 7,051 Vacant Land 535 Commercial Properties 365 Recreation and Entertainment Properties 10 Community Service Properties 47 Industrial Properties 123 Public Service Properties 30 Public Parks, Wild, Forested and Conservation 11 Source NYS ORPTS Muni Pro Website, Brookhaven Town Distribution of Parcels by Property Class
-

Let PTA Represent You
If you didn't receive a mailer, or don't have your code available, you'll need to provide the property details. It will only take a minute or two.
Apply Today -

Market and Assessment Analysis
Data and analysis that comprise the PTA advantage: leveraging historical data and market trends at the Town, and School District, level.
Learn More -

Frequently Asked Questions
Can't I do this myself? What if my property is in a trust? Will this affect my existing exemptions? Is this a kissing book? All these answers, and more…
Learn More