Data and information that demonstrate Property Tax Agency's Analytical Advantage.
Sign up for a Property Tax Grievance.
Town of East Hampton Property Tax Grievance Services
-
East Hampton Assessments
The Town of East Hampton is overwhelmingly residential ‐ 75%, and another 13.5% of parcels are classified as vacant.
East Hampton by Property Class Parcel Type Count Total Parcels 24,708 Agricultural Properties 188 Residential Properties 18,631 Vacant Land 3,351 Commercial Properties 1,616 Recreation and Entertainment Properties 108 Community Service Properties 266 Industrial Properties 19 Public Service Properties 284 Public Parks, Wild, Forested and Conservation 245 Source NYS ORPTS Muni Pro Website, Brookhaven Town Distribution of Parcels by Property Class Assessed Values Percentile Map
Median Assessed Market Value was $1,594,594 for 2023, but the Average (Mean) was $2,508,175 indicating a skew due to some very large numbers at the higher end.
East Hampton Town Percentiles 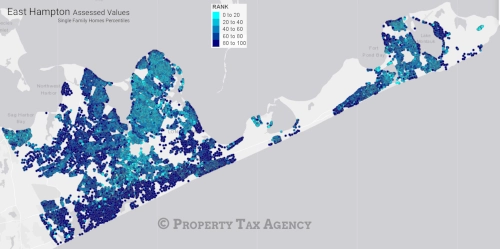
The darker the dot, the higher the percentile of the property in terms of Assessed Value - Navy Blue dots are in the top 20% of all properties in the Town by Assessed Value.
This map illustrates the distribution of Assessed Values for single‐family homes in the Town of East Hampton.
Granted Reductions Map
East Hampton Town Granted Reductions 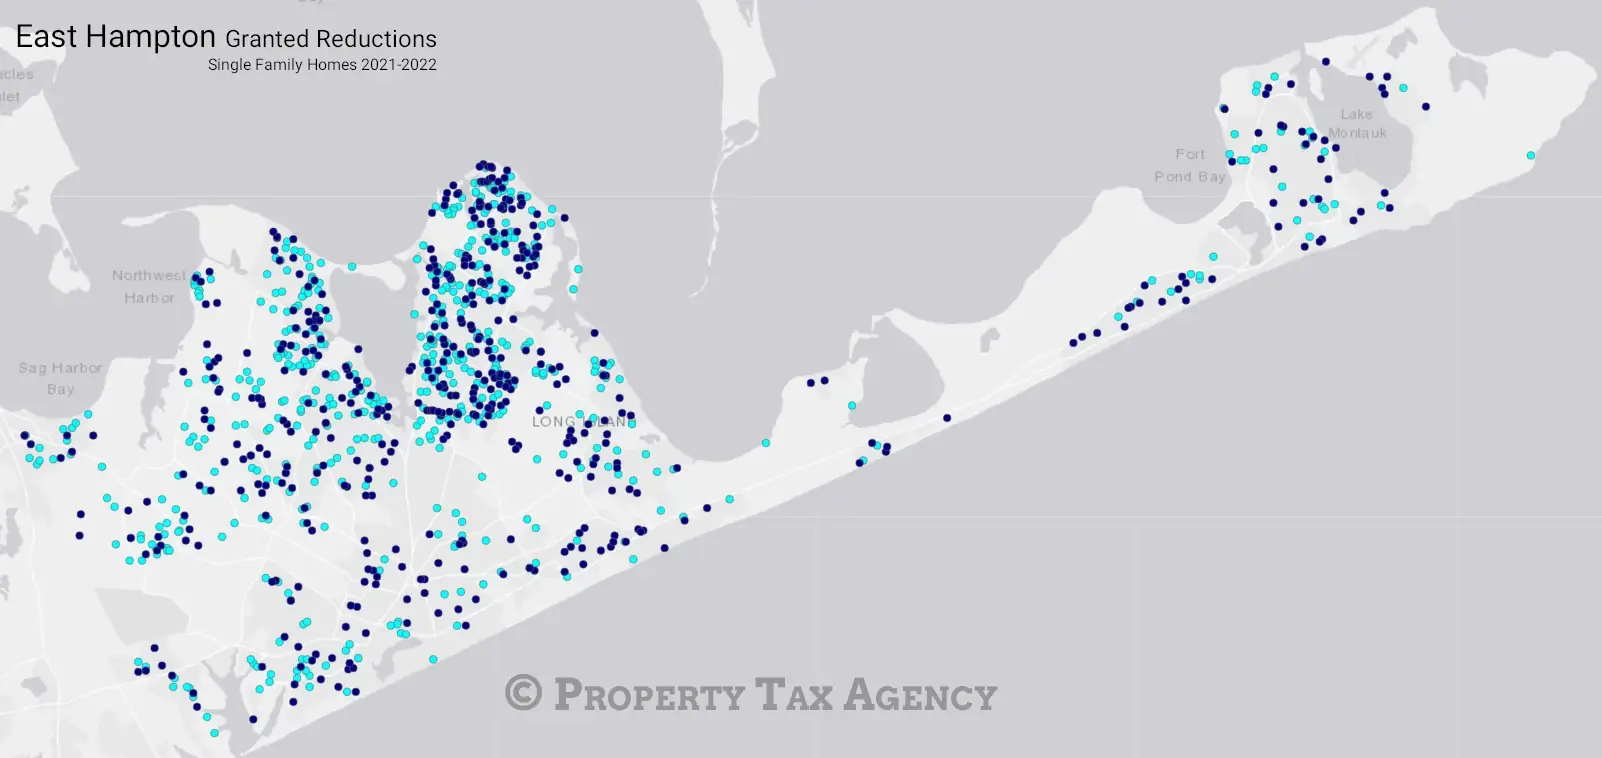
The darker the dot, the higher the percentile of the property in terms of Assessed Value - Navy Blue dots are in the top 20% of all properties in the Town by Assessed Value.
The past informs the future.
Analyzing recently granted reductions helps to identify patterns and opportunities.
Researching recently granted reductions can give insight into what historical market conditions have been successful, and these metrics can be compared to current data to confirm if patterns continue or even intensify.
-
East Hampton Sales Data
This data is not the official Town data, nor is it all of the data, but represents collected data from 2023 conforming to PTA requirements* for market analysis.
Data is provided for example purposes, and no guarantee of suitability for any purpose is implied.
Average Sales Prices Municipality Price Sales Amagansett $4,595,714 7 East Hampton $2,300,797 116 Montauk $2,601,842 19 Existing single family homes, excluding foreclosures and auctions, no "flips". Raw data with no trimming. School District Averages School District Price Sales East Hampton $2,882,796 59 Amagansett $4,595,714 7 Springs $1,635,401 56 Montauk $2,783,333 15 Existing single family homes, excluding foreclosures and auctions, no "flips". Raw data with no trimming. Sales Ratio Study
Comparing current sales in a region to the Assessed Values for the sold properties gives us a insight into what areas are misaligned with the Level of Assessment.
East Hampton Sales Ratio Study June-July-August MEDIAN 0.003381 MEAN 0.003492189 WEIGHTED 0.00294597 AVG ABS DEVIATION 0.001563529 COEFF DISPERSION 46.24457261 PRICE RELATED DIFF 1.147669369 TOTAL AV 318972 TOTAL PRICE $108,274,000 AVG PRICE $2,406,089 N 45 Calculated using property market data compiled by PTA* and the methodology laid out in New York State Department of Taxation and Finance Office of Real Property Tax Services Level of Assessment Owner's Handbook (pdf). -
East Hampton School District
East Hampton School District Percentiles 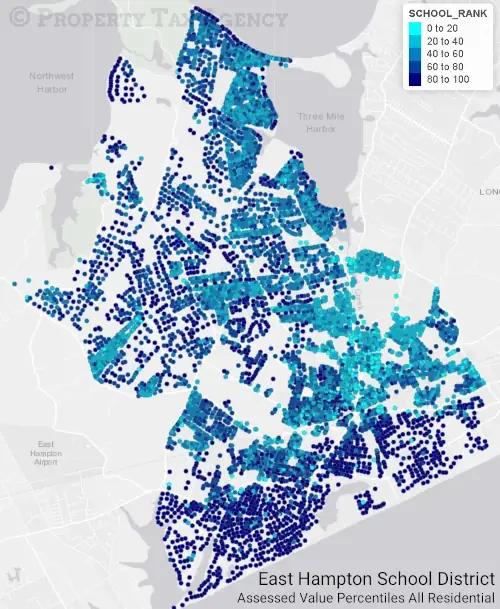
The darker the dot, the higher the percentile of the property in terms of Assessed Value - Navy Blue dots are in the top 20% of all properties in the Town by Assessed Value.
School taxes comprise the majority of most owner's property tax bill; at PTA, assessment analysis is not just performed at the Town level, but also by School District.
East Hampton Schools Parcel Type Count Total Parcels 8,866 Agricultural Properties 64 Residential Properties 6,978 Vacant Land 1,095 Commercial Properties 526 Recreation and Entertainment Properties 37 Community Service Properties 82 Industrial Properties 5 Public Service Properties 27 Public Parks, Wild, Forested and Conservation 52 Source NYS ORPTS Muni Pro Website, Brookhaven Town Distribution of Parcels by Property Class
-

Let PTA Represent You
If you didn't receive a mailer, or don't have your code available, you'll need to provide the property details. It will only take a minute or two.
Apply Today -
Market and Assessment Analysis
Data and analysis that comprise the PTA advantage: leveraging historical data and market trends at the Town, and School District, level.
Learn More -

Frequently Asked Questions
Can't I do this myself? What if my property is in a trust? Will this affect my existing exemptions? Is this a kissing book? All these answers, and more…
Learn More