Sign up for a Babylon Town Property Tax Grievance.
Let Property Tax Agency's Analytical Advantage work for you.
Town of Babylon Property Tax Grievance Services
-
Babylon Real Estate Market Analysis
This data is not the official Town data, nor is it all of the data, but represents about 6 months' data conforming to PTA requirements* for market analysis, derived from public and private datasets.
Data is provided for example purposes, and no guarantee of suitability for any purpose is implied.
Sales by Municipality Municipality AVG Price Sales Amity Harbor $492,500 7 Amityville $553,109 81 Babylon $731,912 70 Copiague $542,455 77 Deer Park $612,376 45 Lindenhurst $565,415 201 North Babylon $561,677 48 West Babylon $559,817 153 Wheatley Heights $583,800 5 Wyandanch $441,089 27 East Farmingdale $530,857 7 North Amityville $335,000 1 Melville $998,333 3 West Gilgo Beach $876,000 1 Farmingdale $677,500 2 Existing single family homes, excluding foreclosures and auctions, no "flips". Raw data with no trimming. Sales by School District School District AVG Price Sales Farmingdale $577,285 7 Babylon $753,829 41 West Babylon $577,054 84 North Babylon $556,660 111 Lindenhurst $561,611 156 Copiague $522,260 98 Amityville $597,376 46 Deer Park $605,521 42 Wyandanch $453,789 29 Half Hollow Hills $648,166 6 Existing single family homes, excluding foreclosures and auctions, no "flips". Raw data with no trimming. Sales Ratio Study ‐ Babylon June July August MEDIAN 0.005931 0.005861 0.006052 MEAN 0.006073 0.006080 0.006201 WEIGHTED 0.006017 0.005931 0.006078 AVG ABS DEVIATION 0.001375 0.001329 0.001509 COEFF DISPERSION 23.18214 22.67605 24.93881 PRICE RELATED DIFF 1.009381 1.025179 1.020350 TOTAL AV 211,770 236,485 333,765 TOTAL PRICE $35,194,240 $39,871,325 $54,912,402 AVG PRICE $533,246 $586,343 $610,137 N 66 68 90 Calculated using property market data compiled by PTA* and the methodology laid out in New York State Department of Taxation and Finance Office of Real Property Tax Services Level of Assessment Owner's Handbook (pdf). -
Babylon ‐ by the Numbers
A breakdown of Town of Babylon Assessment data, demonstrating the distribution of Assessed Values by location and by property class.
Distribution of Parcels Parcel Type Count Total Parcels 69,813 Agricultural Properties 2 Residential Properties 54,852 Vacant Land 5,271 Commercial Properties 5,831 Recreation and Entertainment Properties 605 Community Service Properties 494 Industrial Properties 1,759 Public Service Properties 818 Public Parks, Wild, Forested and Conservation 181 Source NYS ORPTS Muni Pro Website, Brookhaven Town Distribution of Parcels by Property Class Babylon Assessed Values Percentile Map
Babylon Assessed Value Percentiles 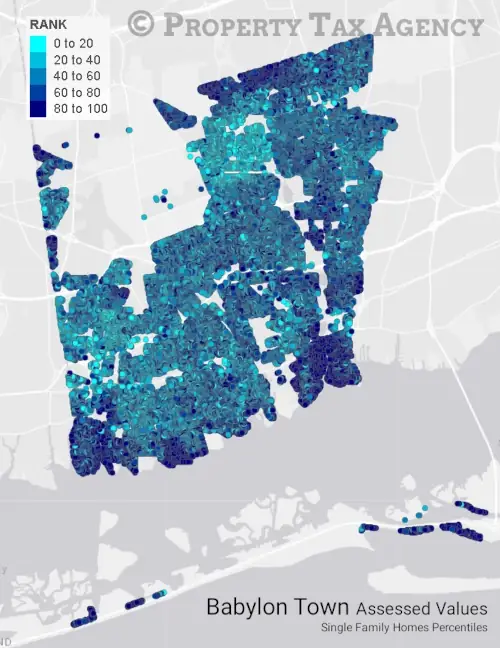
The darker the dot, the higher the percentile of the property in terms of Assessed Value - Navy Blue dots are in the top 20% of all properties in the Town by Assessed Value.
This map illustrates the distribution of Assessed Values for single‐family homes in the Town of Babylon.
By converting Assessment Roll data into interactive mapping system, we can compare sales and Assessment data and plot the locations of each to provide real time analysis of the Real Estate market relative to Levels of Assessment.
Granted Reductions Map ‐ Babylon
Town of Babylon Granted Reductions 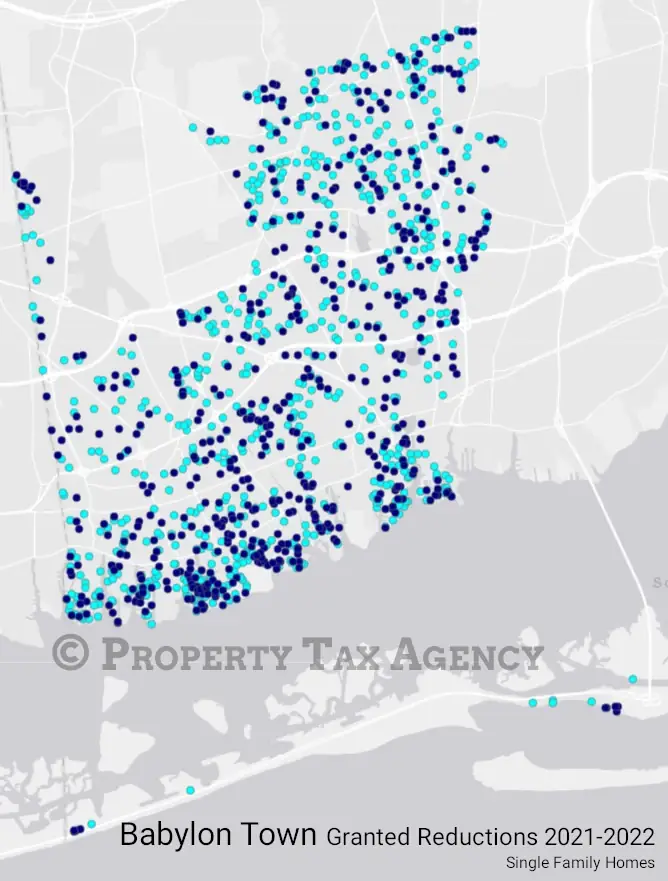
Light blue dots are 2021, navy blue dots are 2022.
Plotting previously granted Assessment Reductions can be informative, we are able to compare historical and current Real Estate market conditions to Assessment data to identify areas of interest.
-
West Babylon School District
School taxes comprise the majority of most owner's property tax bill; at PTA, assessment analysis is not just performed at the Town level, but also by School District.
Median Town Percentile School District Median Town Rank Babylon 70.78 West Babylon 55.01 North Babylon 53.8 Lindenhurst 48.21 Copiague 36.81 Deer Park 57.22 Wyandanch 20.33 Calculating this value allows us to see which School Districts are weighted as higher value neighborhoods from an Assessed Value perspective.
Property Type Distribution
Distribution of Parcels Parcel Type Count Total Parcels 8,172 Agricultural Properties 0 Residential Properties 7,051 Vacant Land 535 Commercial Properties 365 Recreation and Entertainment Properties 10 Community Service Properties 47 Industrial Properties 123 Public Service Properties 30 Public Parks, Wild, Forested and Conservation 11 Source NYS ORPTS Muni Pro Website, Brookhaven Town Distribution of Parcels by Property Class Assessed Values Percentile Map ‐ West Babylon
West Babylon School District Percentiles 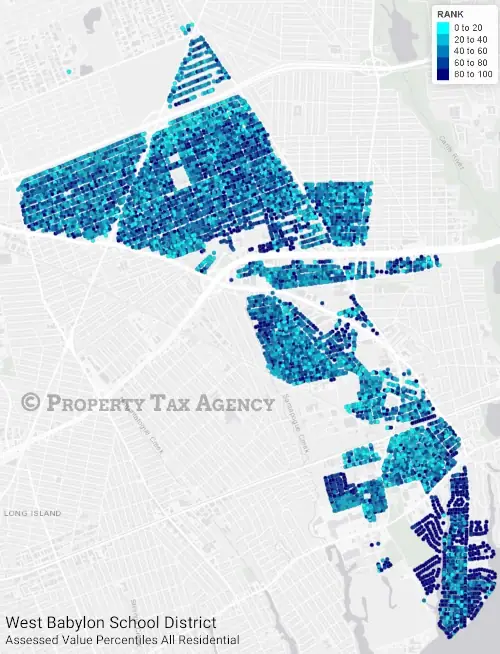
The darker the dot, the higher the percentile of the property in terms of Assessed Value - Navy Blue dots are in the top 20% of all properties in the Town by Assessed Value.
When performing location based analysis of Real Estate trends for the West Babylon School District, this is the base map that indicates Assessed Value Distributions.
-

Let PTA Represent You
If you didn't receive a mailer, or don't have your code available, you'll need to provide the property details. It will only take a minute or two.
Apply Today -
Market and Assessment Analysis
Data and analysis that comprise the PTA advantage: leveraging historical data and market trends at the Town, and School District, level.
Learn More -
Frequently Asked Questions
Can't I do this myself? What if my property is in a trust? Will this affect my existing exemptions? Is this a kissing book? All these answers, and more…
Learn More